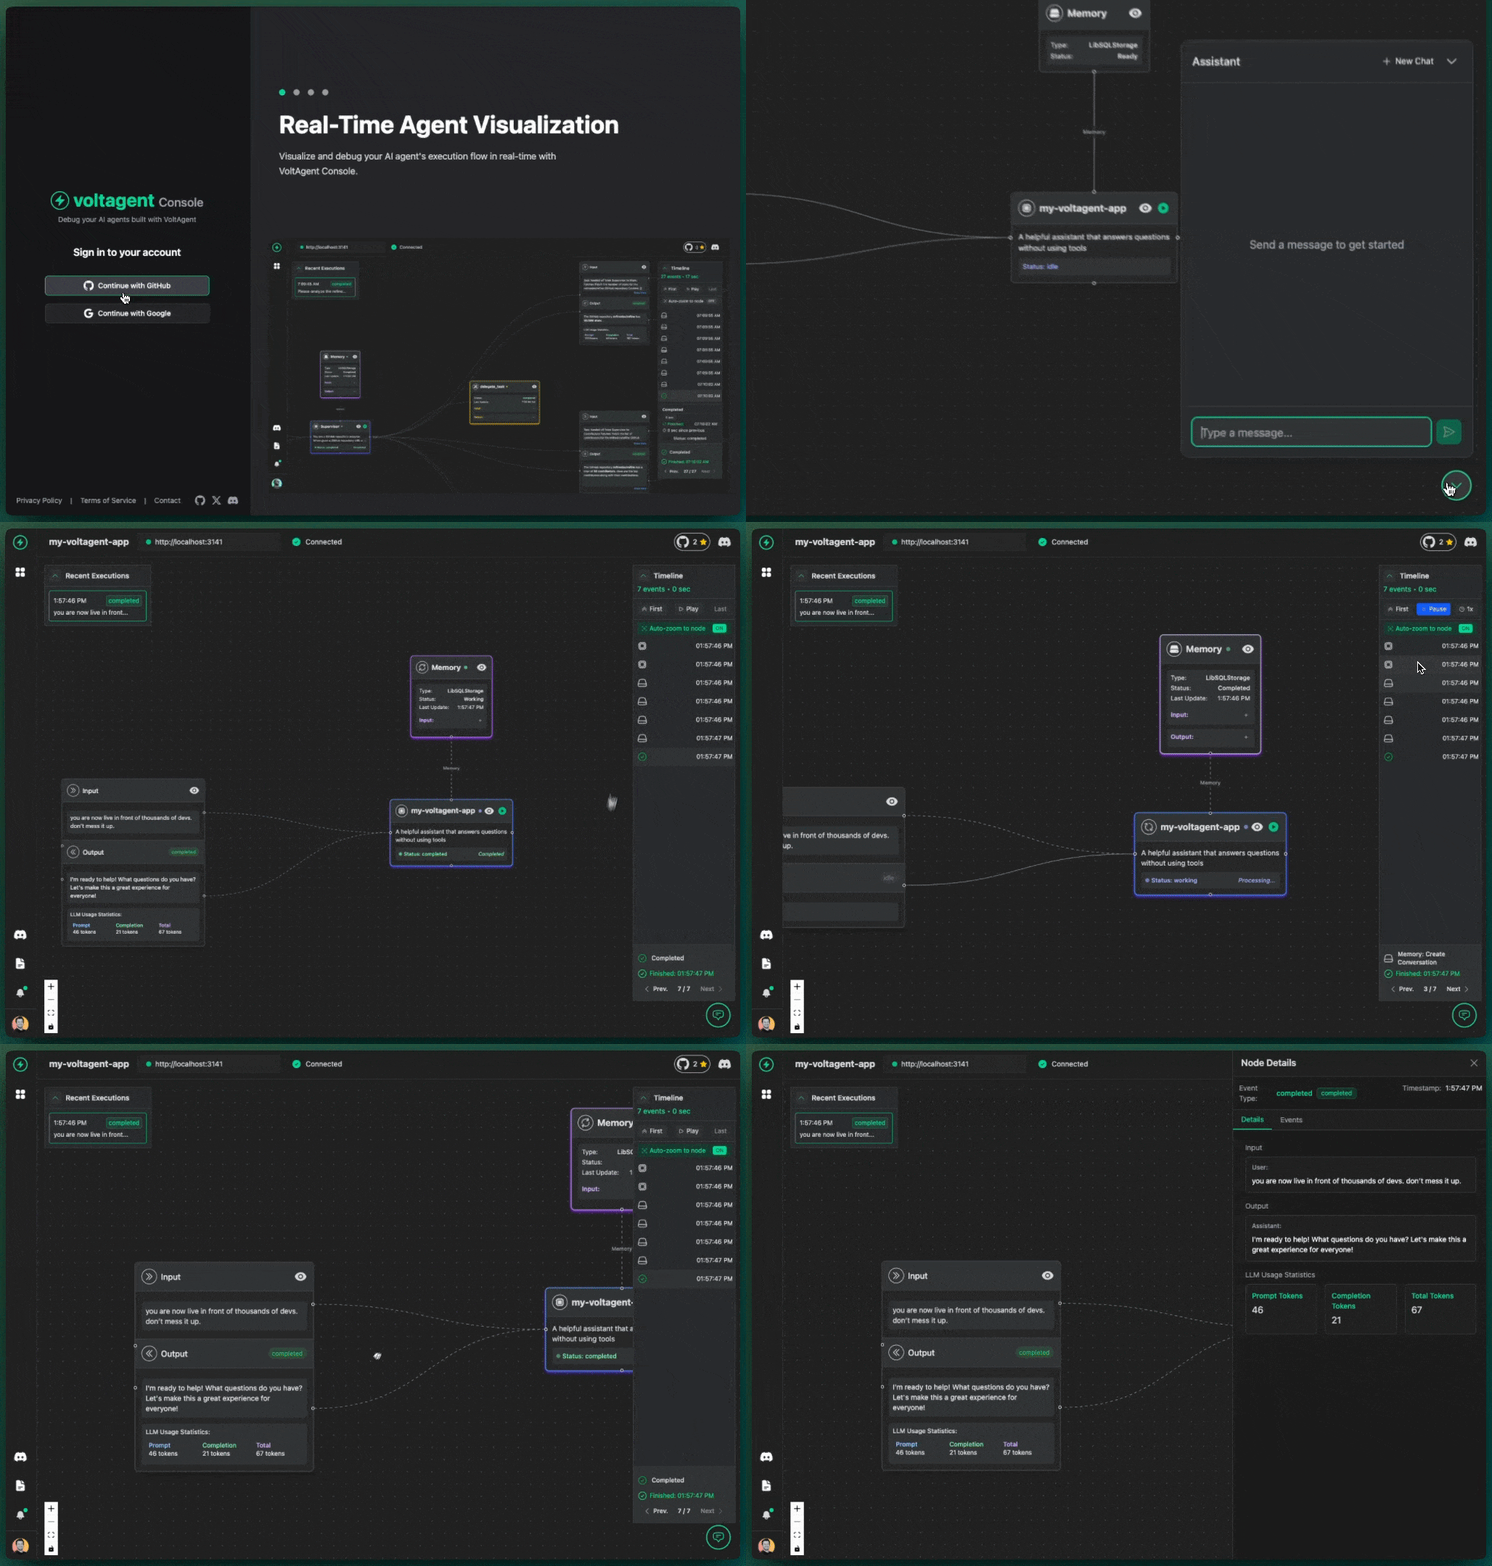
Developer Console
The VoltAgent Developer Console is a web-based tool designed to help you observe and debug your AI agents during development.

Accessing the Console
You can access the hosted Developer Console at: https://console.voltagent.dev/
How it Works
When you run a VoltAgent application locally with observability enabled, it exposes a local server (typically on port 3141). The Developer Console connects directly to this local server via your browser.
Key Features:
- Local Connection: The console communicates directly with your local agent process. No data is sent to or stored on any external servers. Your agent's execution data remains entirely on your machine.
- Real-time Visualization: See the agent's execution flow, including function calls, tool usage, and message history, as it happens.
- Debugging Tools: Inspect the details of each step, view logs, and analyze the agent's state at different points in time.
Getting Started
-
Ensure your VoltAgent application has observability enabled and is running locally. You should see output similar to this in your terminal, confirming the server is ready:
══════════════════════════════════════════════════
  VOLTAGENT SERVER STARTED SUCCESSFULLY
══════════════════════════════════════════════════
  ✓ HTTP Server: http://localhost:3141

  Developer Console:    https://console.voltagent.dev
══════════════════════════════════════════════════
[VoltAgent] All packages are up to date -
Open https://console.voltagent.dev/ in your browser.
-
The console should automatically attempt to connect to
http://localhost:3141. If your agent is running on a different port, you can configure the connection URL in the console's settings.
Exploring the Console Features
Once connected, the Developer Console provides several views to help you understand your agent's behavior:
Agent List View
The main view often displays a list of active or recent agent sessions. This allows you to get a quick overview of agents that have run or are currently running.
Agent Detail View
Clicking on an agent session in the list will take you to the detail view. This is where you can dive deep into a single agent's execution.
Execution Trace/Timeline
Within the detail view, you'll typically find a visual representation of the agent's execution flow. This might be a timeline or a graph showing:
- The sequence of steps the agent took.
- Which functions or tools were called at each step.
- The inputs and outputs of each step.
Message & Log Inspection
You can usually select individual steps in the execution trace to inspect the details, such as:
- The exact messages exchanged (e.g., prompts sent to an LLM, responses received).
- Internal logs or state information recorded by the agent during that step.
- Tool inputs and outputs.
Connection Management
The console provides feedback on its connection status to your local VoltAgent server. Look for indicators (like the ConnectionAlert component) showing whether the connection is active or if there are issues. You might also find settings to change the target URL if your agent isn't running on the default http://localhost:3141.
Using the Console
Once connected, you can navigate through agent runs, inspect individual steps, view detailed logs, and more.